Implementation
Raspberry Pi 3
As the third generation of the Raspberry Pi, it has improvements compared to the last generation production in many aspects. Raspberry Pi 3 exclusively implements 802.11n Wireless LAN, Bluetooth 4.1 and Bluetooth Low Energy (BLE), and owns a 1.2GHz 64-bit quad-core ARMv8 CPU, and continues to have those essential components, such as 1GB RAM, 4 USB ports, full HDMI port, camera interface and display interface. The operating system of Raspberry Pi 3 is Raspbian, an optimized version of Linux for Raspberry Pi.
Raspberry Pi Camera
The Raspberry Pi Camera is installed in Raspberry Pi through its camera interface. It can capture both static images as well as recording videos. In our project, the video first captured by camera then processed through OpenCV.
OpenCV (Open Source Computer Vision)
OpenCV is a library of programming functions mainly aimed at real-time computer vision. It has C++, C, Python and Java interfaces and supports Windows, Linux, Mac OS, iOS and Android. For our project, we use both C++ and Python interfaces to realize the function of real-time video analysing. Moreover, we use OpenCV to train the model for the detection of people's heads.
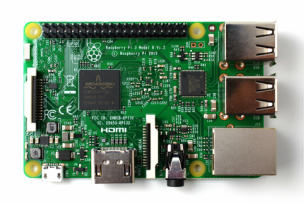
Raspberry Pi 3
|
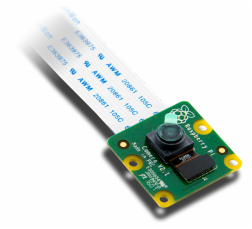
Raspberry Pi Camera
|
Details of decision making processes
1. Detection model
For head detection we use a cascade of boosted classifier in OpenCV. Our training set has about 9k images (5k positive and 4k negative). The cascade classifier contains several stages (simpler classifiers) that are applied subsequently to a region of interest until at some stage the candidate is rejected or all the stages are passed. Each stage is a boosted classifier consists of multiple decision-tree classifiers with at least 2 leaves. Haar-like features are the input to these basic classifiers. The current algorithm uses the following Haar-like features:
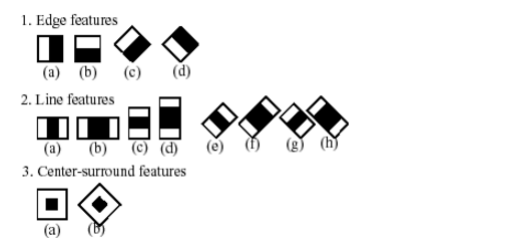
Fig. 1 Haar filters used for detection
2. Display and Data processing
Display
To display the detection result on the screen, first, we mark the seats with blue rectangles. When a person is recognized, a green rectangle will appear on the detected person. When the center of the green rectangle falls in one of the blue rectangles, it means that the person has taken the seat, and at the same time, the blue rectangle will turn red to indicate its occupancy. The result can be seen in Fig. 2 below.
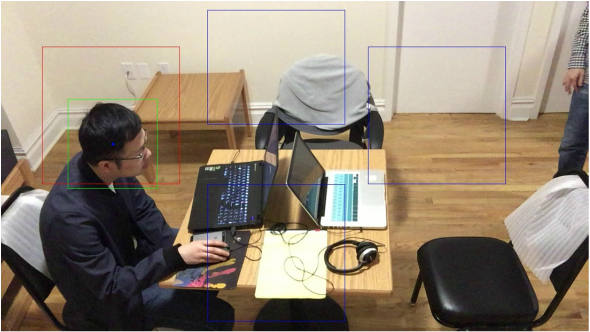
Fig. 2 Detection result.
The three blue rectangle indicates three available seats, and the red one means
the occupancy of that seat when the center of the green rectangle falls in red rectangle.
Accuracy Improvement
Although the training dataset is big enough (almost 10k images) and we have marked seats areas, false detections still cannot be ignored and the quality of detection varies with factors like light and the color of the background. Due to this reason, the major problem encountered is the instability of detection, that is, a person may be recognized in one detection but not recognized the next time. The problem is shown below in Fig. 3.
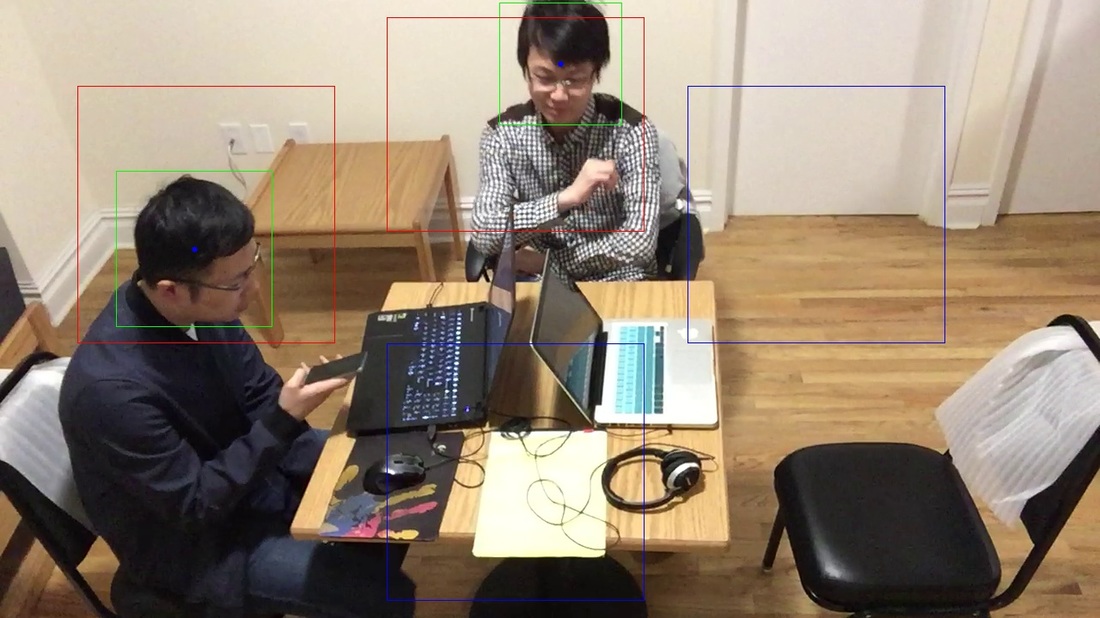
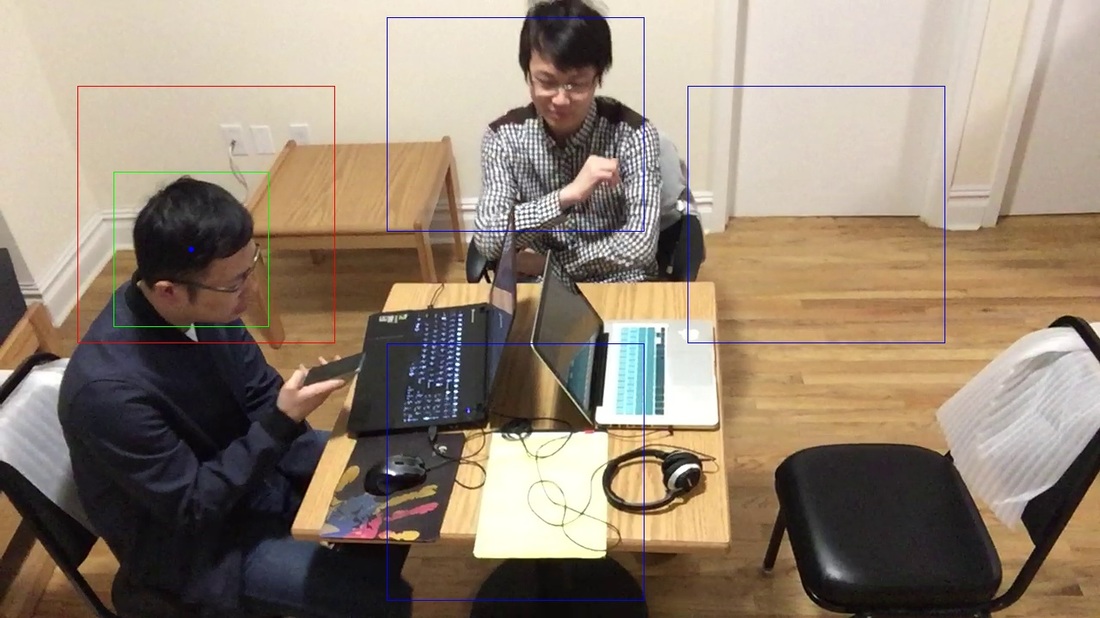
Fig.3 The discontinuity of the detection
The images above are continuous two frames in a video. The left one displays that both people
were recognized, while the right one did not recognize the person near the upper bound of the image.
To avoid that this phenomenon, we choose the median of the ten recent detections results as the number of people. Take one of the seat as a example. The code for taken the median of ten recent detections is as below:
seat1 = [ ]
if len(seat1) >= 10 :
seat1.pop(0)
......
seat1_sort = sorted(seat1)
seat1_sort.sort()
seat1_up = seat1_sort[len(seat1_sort)/2]
Here, "seat1" is the ten recent number of people detected, and seat1_up is the median to upload to AWS.
3. Usage of AWS
The part mainly used is AWS DynamoDB, storing the uploaded data, including timestamp, number of people, and the availability/occupancy status of each seat. Web application also get occupancy information from this table named "IOT project". Fig. 4 is the snapshot of part of the uploaded table.
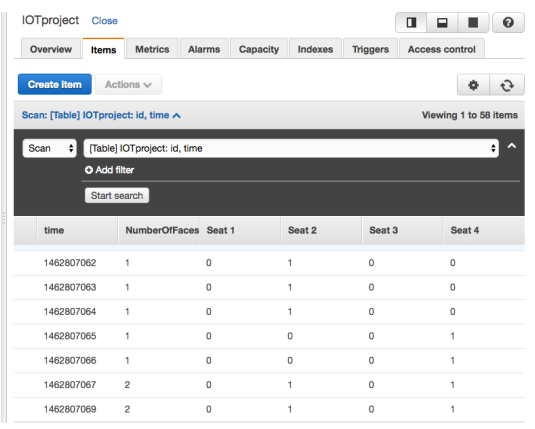
Fig.4 The uploaded data in AWS DynamoDB
The first column is timestamp. The second column shows the number
of recognized people, which is the sum of the numbers of the four columns
in the right. For the four seats, if it is not occupied, its value is 0, otherwise, 1.
The first column is timestamp. The second column shows the number
of recognized people, which is the sum of the numbers of the four columns
in the right. For the four seats, if it is not occupied, its value is 0, otherwise, 1.
4. Web Application
In this part of the project, we complete the web application by building the front end on top of the Flask Python webserver. By extracting data from AWS DynamoDB, we not only display the number of occupied seats, but also indicate the occupancy through the color of the seats. Fig. 5 is an example of the occupancy status.
In this part of the project, we complete the web application by building the front end on top of the Flask Python webserver. By extracting data from AWS DynamoDB, we not only display the number of occupied seats, but also indicate the occupancy through the color of the seats. Fig. 5 is an example of the occupancy status.
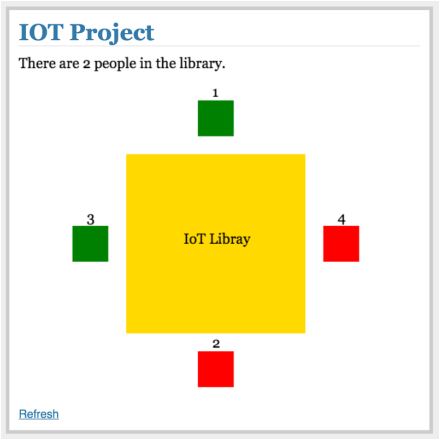
Fig. 5 Snapshot of the website
For the 4 seats in the figure, seat 1 and 3 in green are available; seat 2 and 4 in red are occupied
For the 4 seats in the figure, seat 1 and 3 in green are available; seat 2 and 4 in red are occupied
